
Free Landscape Production Rates Guide with Industry Benchmarks
Bid with confidence using proven production rates from the National Association of Landscape Professionals. Download the free guide landscape contractors trust for accurate labor calculations.
The Foundation of Every Profitable Estimate: Accurate Production Rates
You've measured the property perfectly. You know exactly how many square feet of turf, linear feet of edging, and shrubs to maintain. But when it comes to calculating labor hours, are you guessing? Using outdated rates? Applying the same production rate regardless of terrain difficulty or equipment type?
Inaccurate production rates are the silent profit killer in landscape maintenance contracts.
Underestimate by just 20% on labor hours, and a seemingly profitable $30,000 annual contract becomes a break-even or money-losing headache. Overestimate significantly, and you price yourself out of competitive bids without realizing your calculations don't reflect reality.
Professional landscape estimators rely on validated production rates—industry-standard benchmarks that reflect real-world crew performance with specific equipment under varying site conditions. These rates provide the foundation for accurate labor calculations, appropriate pricing, and predictable profit margins.
Our free Landscape Maintenance Production Rates Guide, developed in partnership with the National Association of Landscape Professionals and Wilson Oyler Group, gives you comprehensive benchmarks for 15+ common landscape maintenance services. This isn't guesswork or generic assumptions—these are proven rates used by successful landscape contractors nationwide to build accurate, profitable estimates.
What's Inside the Guide
Comprehensive, validated production rate benchmarks organized by service category, equipment type, and difficulty level:
- Section 1: Turf Mowing Production Rates
- Section 2: Turf Edging Production Rates
- Section 3: String Trimmer Work
- Section 4: Blower Clean-Up
- Section 5: Policing or Trash Pick-Up
- Section 6: Bed Detail Maintenance
- Section 7: Seasonal Color Beds
- Section 8: Shrub Pruning
- Section 9: Hedge Pruning
- Section 10: Tree Pruning
- Section 11: Irrigation System Maintenance
- Section 12: Spot Spray Application
- Section 13: Fertilizer Application
- Section 14: Mulch Installation
How to Use This Guide
From Industry Benchmarks to Your Customized Production Rates
Step 1: Understand the Baseline Rates
Review all production rates in the guide. Understand how they're calculated (per square foot, per linear foot, per plant, per hour) and what's included (setup time, cleanup, equipment loading/unloading).
Step 2: Assess Your Equipment and Crew
Compare your actual equipment to the guide specifications. Do you use 52" or 61" mowers? Walk-behinds or riders? Your equipment capabilities directly affect which baseline rates apply.
Step 3: Apply to Actual Properties
Use the production rates on properties you currently maintain. Calculate what the estimated hours should be based on measurements and production rates.
Step 4: Compare to Reality
Track actual crew hours on jobs over 4-8 weeks. Compare estimated hours (using guide production rates) to actual performance. Identify patterns and variances.
Step 5: Customize Your Rates
Adjust production rates up or down based on your crew's real performance. If your team consistently mows at 75,000 sq ft/hour with your 72" mower (vs. guide's 80,000), update your rates accordingly.
Step 6: Account for Market Conditions
Regional factors affect production: extreme heat, altitude, aggressive plant growth rates, seasonal variations. Modify rates for your specific market conditions.
Step 7: Document Difficulty Modifiers
Create clear guidelines for when to apply "easy," "moderate," or "difficult" ratings. Train estimators to assess properties consistently using the same criteria.
Step 8: Integrate with Estimating Tools
Input your customized production rates into estimating templates, software, or spreadsheets. Automated calculations ensure consistent application across all estimates.
Step 9: Refine Continuously
Schedule quarterly reviews of production rates. Adjust based on equipment upgrades, crew training improvements, or systematic under/overestimation patterns.
Step 10: Train Your Team
Share production rates with field crews. When everyone understands expected production levels, crews can self-manage to hit efficiency targets.
Disclaimer from NALP: Customize Before Bidding. "These are baseline rates that will help you get started. You need to adjust these rates to your equipment and conditions. You should not use these rates for bidding purposes until you verify that they work for your company."
The Financial Impact of Production Rate Accuracy
Why Small Production Rate Errors Create Large Profit Problems:
Example 1: 20% Mowing Underestimation
Property: 150,000 sq ft of turf, weekly mowing, 36 visits annually
Estimated using 60" rider at 60,000 sq ft/hour = 2.5 hours/visit
Actual crew performance: 48,000 sq ft/hour = 3.125 hours/visit
Variance: 0.625 hours/visit × 36 visits = 22.5 additional hours annually
At $50/hour loaded labor cost = $1,125 annual profit loss (3.75% of $30K contract)
Example 2: Ignoring Difficulty Modifiers
Property: 75,000 sq ft sloped turf with extensive landscaping
Estimated as "moderate" difficulty: 45,000 sq ft/hour = 1.67 hours/visit
Actual difficulty: Should be "difficult" at 40,000 sq ft/hour = 1.875 hours/visit
Variance: 0.205 hours/visit × 36 visits = 7.4 additional hours annually
At $50/hour = $370 annual profit loss
Compound Effect:
Properties with multiple underestimated services (mowing + edging + bed detail) can easily lose 10-15% of contract value to inaccurate production rates—turning seemingly profitable $40K contracts into break-even or money-losing operations.
Industry Data on Production Rate Impact:
- 88% of landscape contractors report that labor hour underestimation is among their top three profitability challenges.
- Average production rate variance between industry benchmarks and actual contractor performance: 15-25%, depending on equipment quality, crew experience, and regional conditions.
- Contractors who track and refine production rates quarterly maintain 12-18% higher gross margins than those using static, unverified rates.
- Equipment efficiency impact: Upgrading from 52" walk-behind to 60" zero-turn rider can increase mowing production 30-40%, but only if estimators update production rates to reflect the new capabilities.
- Difficulty modifier significance: The difference between "easy" and "difficult" mowing conditions represents 20-30% production variance—easily the difference between profitable and unprofitable contracts.
FAQs
No. The National Association of Landscape Professionals explicitly states these are baseline rates requiring verification with your specific equipment, crew, and conditions before using for actual bids. Test on known properties first.
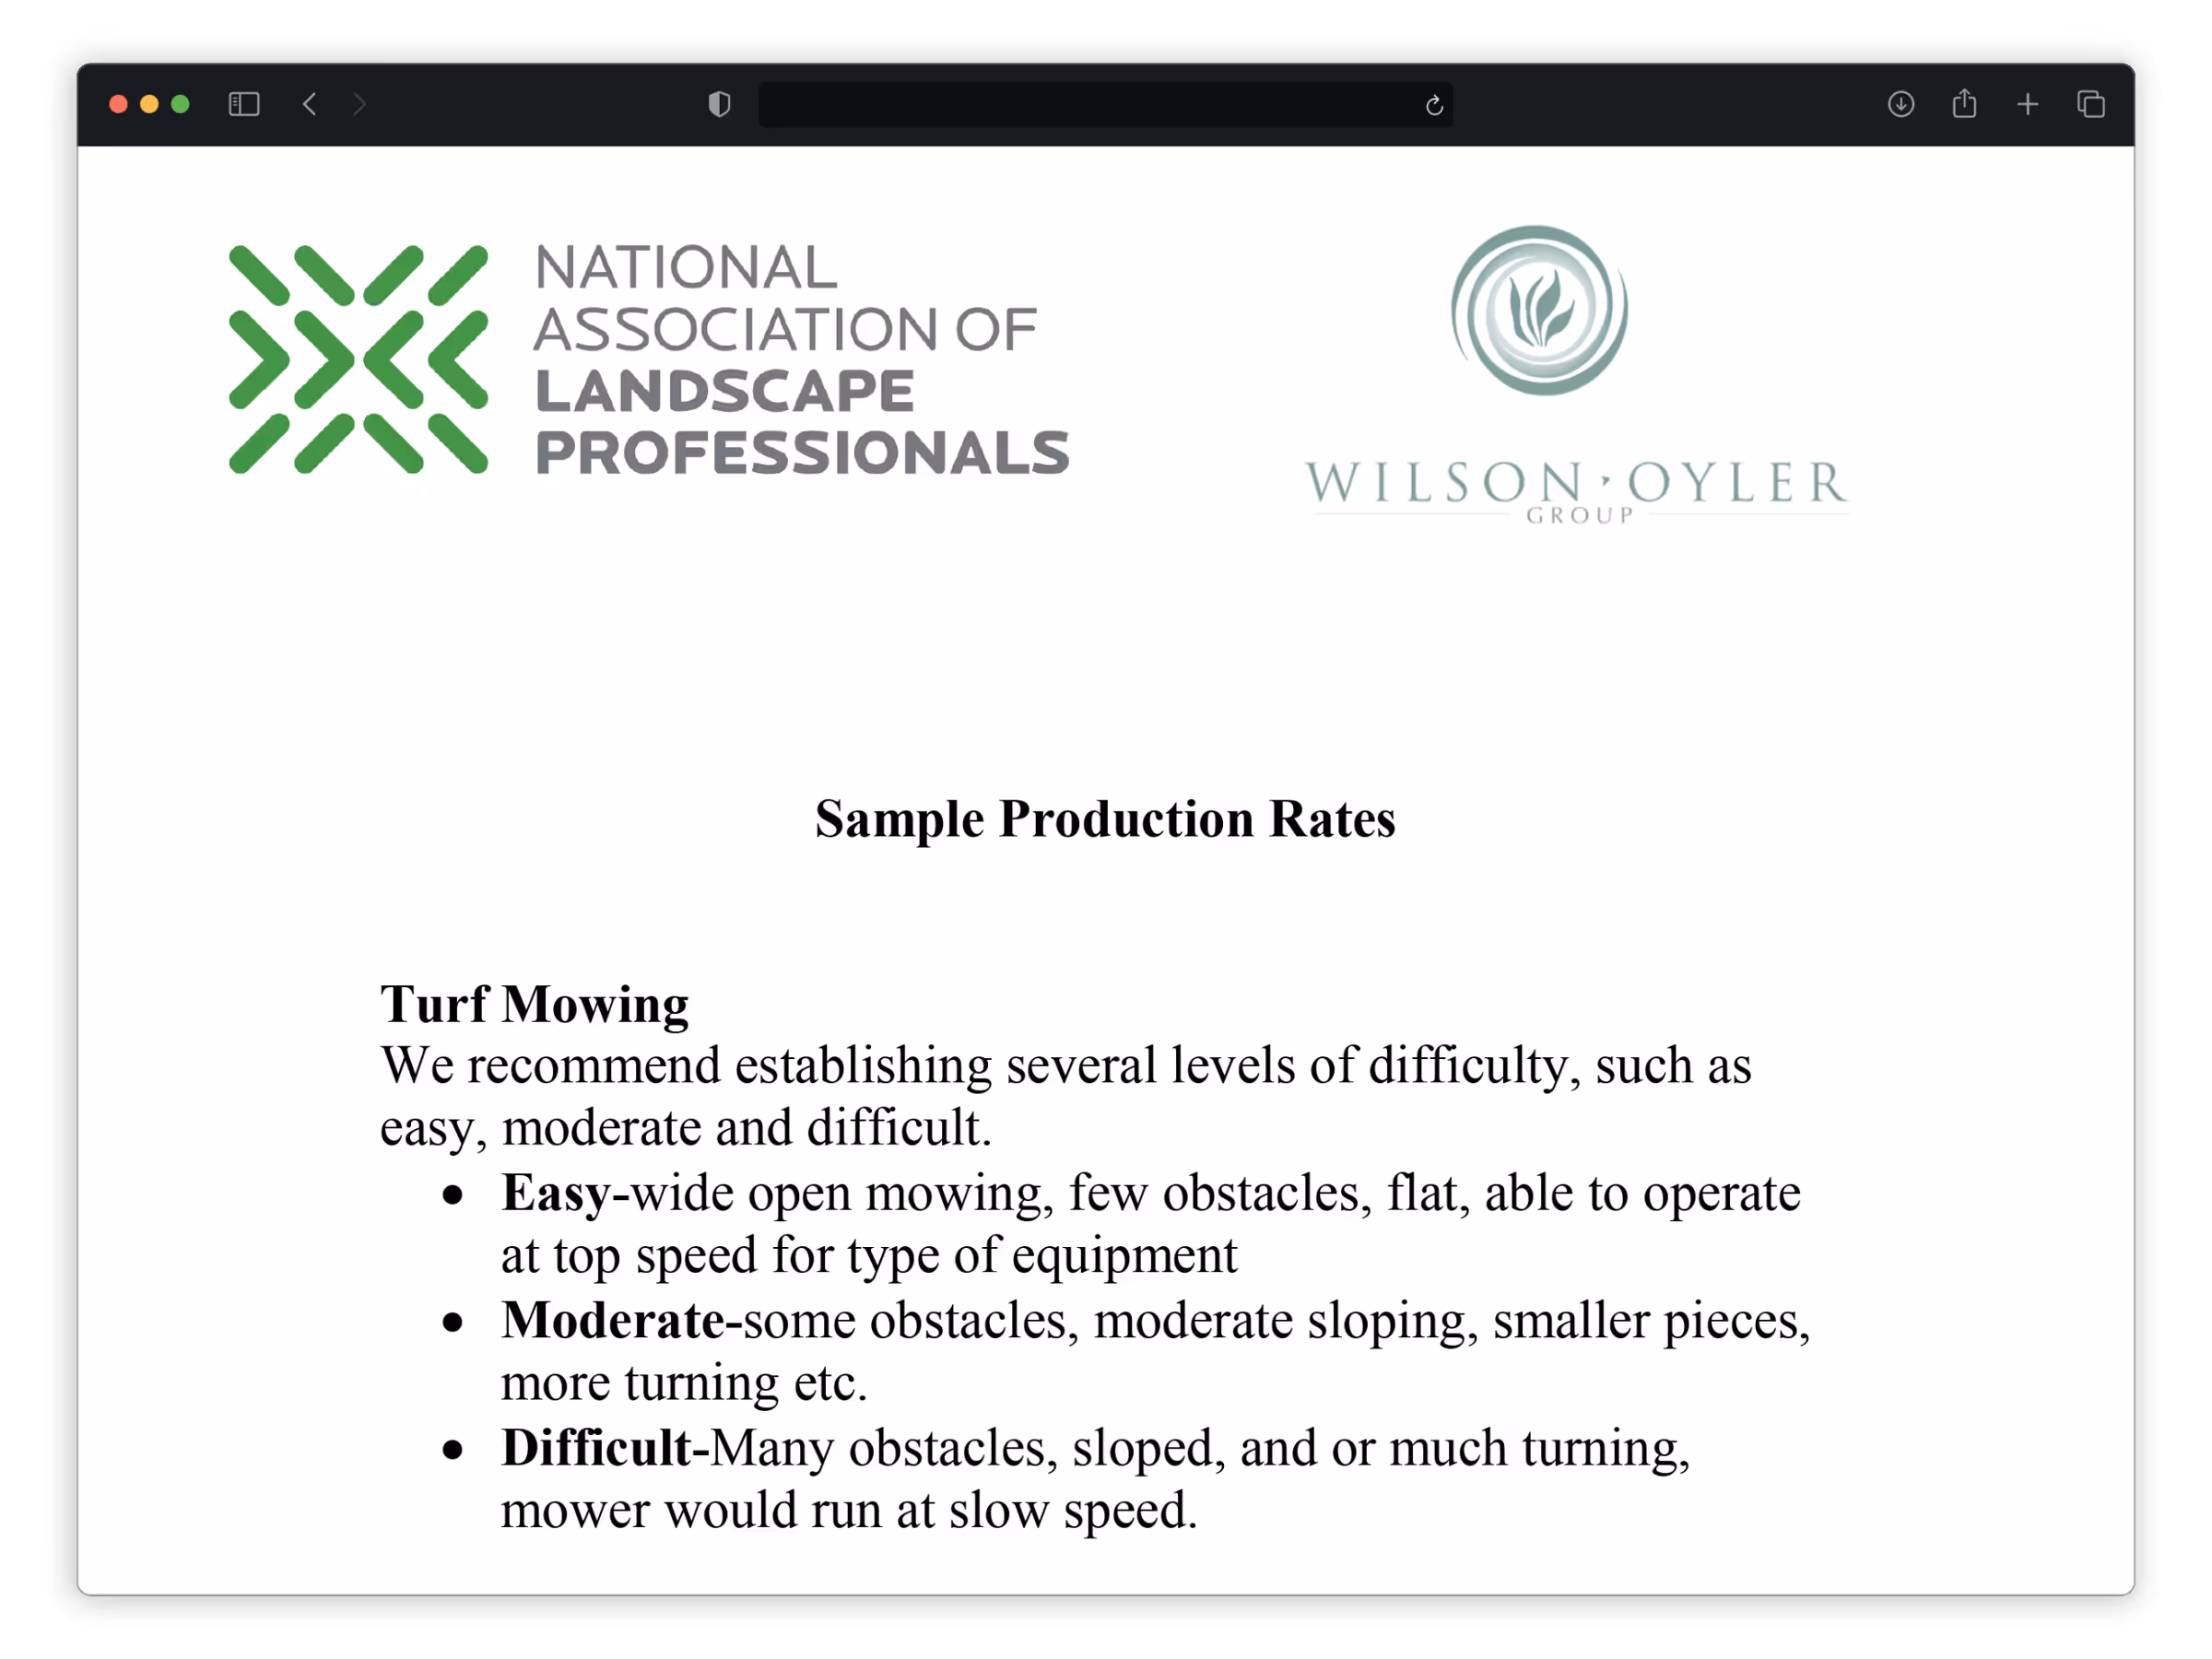
Easy = wide open, few obstacles, flat, top speed operation. Moderate = some obstacles, moderate slopes, more turning. Difficult = many obstacles, steep slopes, extensive turning, reduced speed. When uncertain, estimate as moderate and adjust after tracking actual performance.
Yes. Mowing rates include associated trim work with push mower or string trimmer. The guide specifies 'with trim mower' for applicable categories.
Measure and calculate separately. If 100,000 sq ft is easy terrain and 25,000 sq ft is difficult, calculate each using appropriate production rates and sum the total labor hours.
Review quarterly during the first year, then semi-annually once your rates are stable. Make immediate adjustments after major equipment changes, crew composition shifts, or systematic under/overestimation patterns.
It appears in both 'Turf Edging' and 'Bed Edging' sections because edging can be calculated as part of turf maintenance or bed maintenance depending on your service breakdown structure.
No. These rates apply specifically to routine maintenance on regular cycles. Installation, restoration, renovation, and initial cleanup require different (typically much lower) production rates.
The 43,000 sq ft/hour rate includes the physical application process with a push spreader, but not product cost calculation or preparation time.
Production rates cover on-site time only. Add travel time separately based on your specific route structure, or build travel time into your hourly overhead calculations.
The 2.5 cubic yards/hour rate assumes hand spreading with wheelbarrow transport under 100 feet. Mulch blower equipment dramatically increases production but requires different rate calculations.
Yes. The guide is designed for internal team use. Share with all estimators to create standardized methodology across your company.